
|
|
|
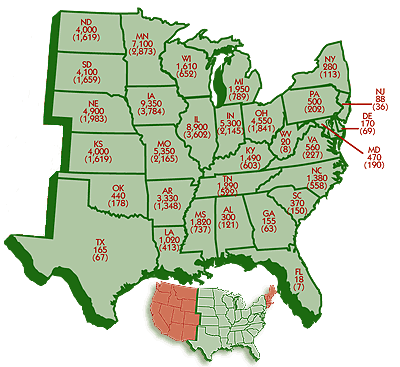
Soybean
Area Planted by State 2011 |
|
Thousand Acres
(Thousand Hectares) |
Alabama
Arkansas
Delaware
Florida
Georgia
Illinois
Indiana
Iowa
Kansas
Kentucky
Louisiana |
300
3,330
170
18
155
8,900
5,300
9,350
4,000
1,490
1,020 |
(121)
(1,348)
(69)
(7)
(63)
(3,602)
(2,145)
(3,784)
(1,619)
(603)
(413) |
|
Maryland
Michigan
Minnesota
Mississippi
Missouri
Nebraska
New Jersey
New York
N. Carolina
N. Dakota
Ohio |
470
1,950
7,100
1,820
5,350
4,900
88
280
1,380
4,000
4,550 |
(190)
(789)
(2,873)
(737)
(2,165)
(1,983)
(36)
(113)
(558)
(1,619)
(1,841) |
|
Oklahoma
Pennsylvania
S. Carolina
S. Dakota
Tennessee
Texas
Virginia
W. Virginia
Wisconsin |
440
500
370
4,100
1,290
165
560
20
1,610 |
(178)
(202)
(150)
(1,659)
(522)
(67)
(227)
(8)
(652) |
|
| Source: USDA |
|
|
|
|
Return to Soy Stats homepage |
Order printed Soy Stats |
|
Major funding for the 2012 edition of Soy Stats® was provided by the United Soybean Board, with additional financial support from the Illinois Soybean Association, Iowa Soybean Association, Indiana Soybean Alliance, South Dakota Soybean Research & Promotion Council, North Dakota Soybean Council, Maryland Soybean Board, U.S. Soybean Export Council, Kentucky Soybean Board, Ohio Soybean Council, Minnesota Soybean Research and Promotion Council, Tennessee Soybean Promotion Council, North Carolina Soybean Producers Association, Kansas Soybean Commission, and Oklahoma Soybean Board.
|
|
Soy Stats® is copyright © 1994-2012 The American Soybean Association.
All Rights Reserved. |
|
|
|