|
|
|
U.S.
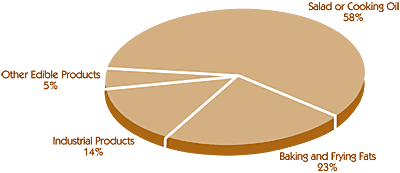
Soybean Oil Consumption 2010 |
 |
|
Million
Pounds |
|
Million
Metric Tons |
|
|
. |
|
. |
|
| Salad or
Cooking Oil |
9,595 |
|
4.35 |
|
| Baking and
Frying Fats |
3,895 |
|
1.77 |
|
| Industrial
Products |
2,261 |
|
1.03 |
|
| Other Edible
Products |
873 |
|
0.40 |
|
|
. |
|
. |
|
| Total |
16,624 |
|
7.54 |
|
|
. |
|
. |
|
| Source: U.S. Census Bureau,
Calendar Year, subject to revision |
|
|
|
Return to Soy Stats homepage |
Order printed Soy Stats |
|
Major funding for the 2011 edition of Soy
Stats® was provided by the United Soybean Board, with additional
financial support from the Iowa Soybean Association, Illinois Soybean
Association, Indiana Soybean Alliance, South Dakota Soybean Research &
Promotion Council, North Dakota Soybean Council, U.S. Soybean Export
Council, Ohio Soybean Council, Kentucky Soybean Board, Kansas Soybean
Commission, Tennessee Soybean Promotion Council, Minnesota Soybean
Research & Promotion Council, North Carolina Soybean Producers
Association, Oklahoma Soybean Board, and Arkansas Soybean Association &
Texas Soybean Association. |
|
Soy Stats® is copyright © 1994-2011 The American Soybean Association.
All Rights Reserved. |
|
|
|
|