|
|
|
U.S.
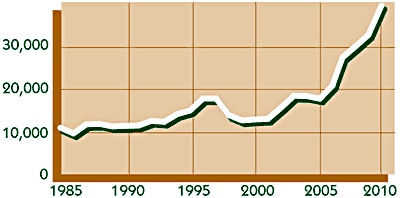
Soybean Crop Value 1985-2010 |

|
1985
1986
1987
1988
1989
1990
1991
1992
1993 |
10,600
9,286
11,394
11,492
10,916
11,042
11,087
12,176
11,974 |
|
|
1994
1995
1996
1997
1998
1999
2000
2001
2002 |
|
13,756
14,617
17,400
17,373
13,513
12,288
12,521
12,663
15,240 |
|
|
2003
2004
2005
2006
2007
2008
2009
2010 |
18,012
17,932
17,337
20,499
26,884
29,458
32,145
38,915 |
|
| Source: USDA |
|
|
|
|
|
|
Return to Soy Stats homepage |
Order printed Soy Stats |
|
Major funding for the 2011 edition of Soy
Stats® was provided by the United Soybean Board, with additional
financial support from the Iowa Soybean Association, Illinois Soybean
Association, Indiana Soybean Alliance, South Dakota Soybean Research &
Promotion Council, North Dakota Soybean Council, U.S. Soybean Export
Council, Ohio Soybean Council, Kentucky Soybean Board, Kansas Soybean
Commission, Tennessee Soybean Promotion Council, Minnesota Soybean
Research & Promotion Council, North Carolina Soybean Producers
Association, Oklahoma Soybean Board, and Arkansas Soybean Association &
Texas Soybean Association. |
|
Soy Stats® is copyright © 1994-2011 The American Soybean Association.
All Rights Reserved. |
|
|
|