|
|
|
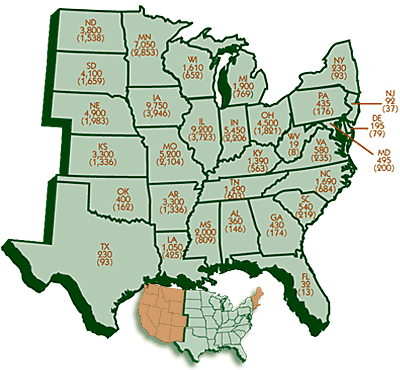
Soybean
Area Planted by State 2008 |

|
Thousand Acres
(Thousand Hectares) |
Alabama
Arkansas
Delaware
Florida
Georgia
Illinois
Indiana
Iowa
Kansas
Kentucky
Louisiana |
360
3,300
195
32
430
9,200
5,450
9,750
3,300
1,390
1,050 |
(146)
(1,336)
(79)
(13)
(174)
(3,723)
(2,206)
(3,946)
(1,336)
(563)
(425) |
|
Maryland
Michigan
Minnesota
Mississippi
Missouri
Nebraska
NewJersey
New York
N.Carolina
N.Dakota
Ohio |
495
1,900
7,050
2,000
5,200
4,900
92
230
1,690
3,800
4,500 |
(200)
(769)
(2,853)
(809)
(2,104)
(1,983)
(37)
(93)
(684)
(1,538)
(1,821) |
|
Oklahoma
Pennsylvania
S.Carolina
S.Dakota
Tennessee
Texas
Virginia
W.Virginia
Wisconsin |
400
435
540
4,100
1,490
230
580
19
1610 |
(162)
(176)
(219)
(1,659)
(603)
(93)
(235)
(8)
(652) |
|
| Source: USDA |
|
|
|
|
Return to Soy Stats homepage |
Order a printed Soy Stats |
|
Major funding for the 2009 edition of Soy Stats® was provided by the United Soybean
Board, with additional financial
support of the Illinois Soybean Association, Indiana Soybean Alliance, Iowa Soybean Association, South Dakota Soybean Research & Promotion Council, North Dakota Soybean Council, Ohio Soybean Association, U.S. Soybean Export Council, Minnesota Soybean Research & Promotion Council, North Carolina Soybean Producers Association, Arkansas Soybean Association and Texas Soybean Association. |
Soy
Stats®
is copyright © 1994-2009 The American Soybean Association. All Rights
Reserved. |
|
|
|