
|
|
|
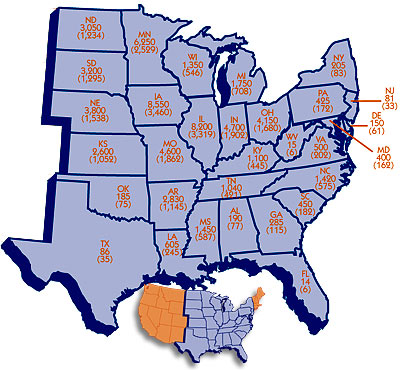
Soybean
Area Planted by State 2007 |
|
Thousand Acres
(Thousand Hectares) |
Alabama
Arkansas
Delaware
Florida
Georgia
Illinois
Indiana
Iowa
Kansas
Kentucky
Louisiana |
190
2,830
150
14
285
8,200
4,700
8,550
2,600
1,100
605 |
(77)
(1,145)
(61)
(6)
(115)
(3,319)
(1,902)
(3,460)
(1,0525)
(445)
(245) |
|
Maryland
Michigan
Minnesota
Mississippi
Missouri
Nebraska
NewJersey
New York
N.Carolina
N.Dakota
Ohio |
400
1,750
6,250
1,450
4,600
3800
81
205
1,420
3,050
4,150 |
(162)
(708)
(2,529)
(587)
(1,862)
(1,538)
(33)
(83)
(575)
(1,234)
(1,680) |
|
Oklahoma
Pennsylvania
S.Carolina
S.Dakota
Tennessee
Texas
Virginia
W.Virginia
Wisconsin |
185
425
450
3,200
1,040
86
500
15
1350 |
(75)
(172)
(182)
(1,295)
(421)
(35)
(202)
(6)
(546) |
|
| Source: USDA |
|
|
|
| Return to Soy Stats homepage |
Order a printed Soy Stats |
| Major funding for the 2008 edition of Soy StatsŇ was
provided by the United Soybean Board, with additional financial
support of the Illinois Soybean Association, Indiana Soybean Alliance,
Iowa Soybean Association, Ohio Soybean Association, South Dakota Soybean Research &
Promotion Council, North Dakota Soybean Council, the U.S. Soybean
Export Council, Minnesota Soybean Research & Promotion Council,
North Carolina Soybean Producers Association, Arkansas Soybean
Association and Texas Soybean Association. |
Soy
Stats®
is copyright © 1994-2008 The American Soybean Association. All Rights
Reserved. |
|
|
|