
|
|
|
U.S.
Fats & Oils Edible Consumption 2011 |
|
|
Million
Pounds |
|
Million
Metric Tons |
|
|
. |
|
. |
|
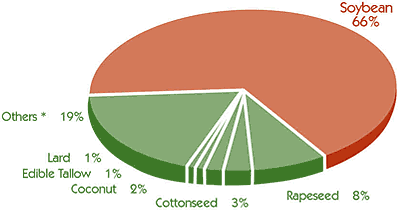
| Soybean |
14,100 |
. |
6.40 |
|
| Canola (rapeseed) |
1,650 |
|
0.75 |
|
| Cottonseed |
695 |
|
0.32 |
|
| Coconut |
370 |
|
0.17 |
|
| Edible
Tallow |
250 |
|
0.11 |
|
| Lard |
200 |
|
0.09 |
|
| Others
* |
3,950 |
|
1.79 |
|
|
. |
|
. |
|
| Total |
21,215 |
|
9.62 |
|
|
. |
|
. |
|
| Source: Industry
estimates. U.S. Census Bureau has discontinued this report.
*Other includes
corn, palm, palm kernel, peanut, sunflower, safflower and others. |
|
|
|
Return to Soy Stats homepage |
Order printed Soy Stats |
|
Major funding for the 2012 edition of Soy Stats® was provided by the United Soybean Board, with additional financial support from the Illinois Soybean Association, Iowa Soybean Association, Indiana Soybean Alliance, South Dakota Soybean Research & Promotion Council, North Dakota Soybean Council, Maryland Soybean Board, U.S. Soybean Export Council, Kentucky Soybean Board, Ohio Soybean Council, Minnesota Soybean Research and Promotion Council, Tennessee Soybean Promotion Council, North Carolina Soybean Producers Association, Kansas Soybean Commission, and Oklahoma Soybean Board.
|
|
Soy Stats® is copyright © 1994-2012 The American Soybean Association.
All Rights Reserved. |
|
|
|
|