|

|
|
|
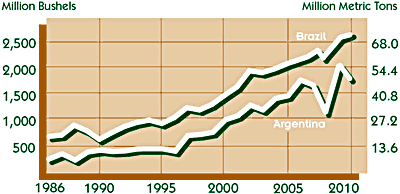
Brazil
& Argentina Soybean Production 1986-2010 |

|
Million Bushels (Million Metric Tons) |
Brazil |
1986
1987
1988
1989
1990
1991
1992
1993
1994
1995
1996
1997
1998
1999
2000
2001
2002
2003
2004
2005
2006
2007
2008
2009
2010 |
636
662
853
747
579
709
827
907
952
887
1,003
1,194
1,150
1,257
1,433
1,598
1,910
1,874
1,947
2.094
2,168
2,241
2,124
2,535
2,572 |
(17.31)
(18.02)
(23.22)
(20.33)
(15.76)
(19.30)
(22.51)
(24.69)
(25.91)
(24.15)
(27.30)
(32.50)
(31.30)
(34.20)
(39.00)
(43.50)
(52.00)
(51.00)
(53.00)
(57.00)
(59.00)
(61.00)
(57.80)
(69.00)
(70.00) |
|
|
|
Argentina |
1986
1987
1988
1989
1990
1991
1992
1993
1994
1995
1996
1997
1998
1999
2000
2001
2002
2003
2004
2005
2006
2007
2008
2009
2010 |
257
356
239
395
423
410
417
456
459
457
411
716
735
779
1,021
1,102
1,304
1,212
1,433
1,488
1,793
1,698
1,175
2,003
1,818 |
(7.00)
(9.69)
(6.51)
(10.75)
(11.51)
(11.16)
(11.35)
(12.41)
(12.49)
(12.44)
(11.20)
(19.50)
(20.00)
(21.20)
(27.80)
(30.00)
(35.50)
(33.00)
(39.00)
(40.50)
(48.80)
(46.20)
(32.00)
(54.50)
(49.50) |
|
|
| Source: USDA |
|
|
|
Return to Soy Stats homepage |
Order printed Soy Stats |
|
Major funding for the 2011 edition of Soy
Stats® was provided by the United Soybean Board, with additional
financial support from the Iowa Soybean Association, Illinois Soybean
Association, Indiana Soybean Alliance, South Dakota Soybean Research &
Promotion Council, North Dakota Soybean Council, U.S. Soybean Export
Council, Ohio Soybean Council, Kentucky Soybean Board, Kansas Soybean
Commission, Tennessee Soybean Promotion Council, Minnesota Soybean
Research & Promotion Council, North Carolina Soybean Producers
Association, Oklahoma Soybean Board, and Arkansas Soybean Association &
Texas Soybean Association. |
|
Soy Stats® is copyright © 1994-2011 The American Soybean Association.
All Rights Reserved. |
|
|
|
|