|
|
|
U.S.
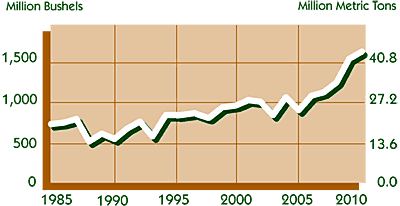
Soybean Exports 1985-2010 |

|
Million Bushels
(Million Metric Tons) |
1985
1986
1987
1988
1989
1990
1991
1992
1993 |
740
757
802
527
623
557
684
770
589 |
(20.14)
(20.60)
(21.83)
(14.34)
(16.96)
(15.16)
(18.62)
(20.96)
(16.03) |
|
|
1994
1995
1996
1997
1998
1999
2000
2001
2002 |
838
851
882
872
805
975
996
1,063
1,045 |
(22.81)
(23.16)
(24.00)
(23.76)
(21.91)
(26.54)
(27.10)
(28.92)
(28.44) |
|
|
2003
2004
2005
2006
2007
2008
2009
2010 |
880
1,097
940
1,116
1,159
1,279
1,501
1,590 |
(23.95)
(29.86)
(25.59)
(30.39)
(31.55)
(34.81)
(40.85)
(43.27) |
|
|
|
|
| Source: USDA |
|
|
|
Return to Soy Stats homepage |
Order printed Soy Stats |
|
Major funding for the 2011 edition of Soy
Stats® was provided by the United Soybean Board, with additional
financial support from the Iowa Soybean Association, Illinois Soybean
Association, Indiana Soybean Alliance, South Dakota Soybean Research &
Promotion Council, North Dakota Soybean Council, U.S. Soybean Export
Council, Ohio Soybean Council, Kentucky Soybean Board, Kansas Soybean
Commission, Tennessee Soybean Promotion Council, Minnesota Soybean
Research & Promotion Council, North Carolina Soybean Producers
Association, Oklahoma Soybean Board, and Arkansas Soybean Association &
Texas Soybean Association. |
|
Soy Stats® is copyright © 1994-2011 The American Soybean Association.
All Rights Reserved. |
|
|
|
|