|
|
|
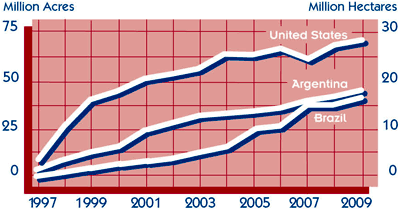
Adoption
of Biotech-enhanced Soybean Seedstock 1997-2009
(Major Exporting Countries Only) |

|
|
Million Acres
(Million Hectares) |
|
|
United States |
|
| Year |
|
Total
Acres/Ha |
|
Biotech
Acres/Ha |
|
Biotech
Percent |
|
| 1997 |
|
70.0 |
(28.3) |
|
8.9 |
(3.6) |
|
12.7 |
|
| 1998 |
|
72.0 |
(29.1) |
|
25.2 |
(10.2) |
|
35.0 |
|
| 1999 |
|
73.7 |
(29.8) |
|
37.1 |
(15.0) |
|
50.3 |
|
| 2000 |
|
74.3 |
(30.1) |
|
40.8 |
(16.5) |
|
54.9 |
|
| 2001 |
|
74.1 |
(30.0) |
|
52.61 |
(21.3) |
|
71.0 |
|
| 2002 |
|
72.8 |
(29.5) |
|
56.1 |
(22.7) |
|
77.0 |
|
| 2003 |
|
72.3 |
(29.3) |
|
58.6 |
(23.7) |
|
81.0 |
|
| 2004 |
|
75.2 |
(30.4) |
|
63.9 |
(25.8) |
|
85.0 |
|
| 2005 |
|
72.0 |
(29.1) |
|
62.6 |
(25.3) |
|
87.0 |
|
| 2006 |
|
75.5 |
(30.6) |
|
67.2 |
(27.2) |
|
89.0 |
|
| 2007 |
|
63.6 |
(25.7) |
|
57.8 |
(23.4) |
|
91.0 |
|
| 2008 |
|
75.7 |
(30.6) |
|
69.6 |
(28.2) |
|
92.0 |
|
| 2009 |
|
77.5 |
(31.4) |
|
70.5 |
(28.6) |
|
91.0 |
|
Argentina |
|
| Year |
|
Total
Acres/Ha |
|
Biotech
Acres/Ha |
|
Biotech
Percent |
|
| 1997 |
|
15.3 |
(6.2) |
|
3.5 |
(1.4) |
|
22.9 |
|
| 1998 |
|
17.3 |
(7.1) |
|
10.6 |
(4.3) |
|
61.2 |
|
| 1999 |
|
20.3 |
(7.0) |
|
15.8 |
(6.4) |
|
90.0 |
|
| 2000 |
|
23.7 |
(9.6) |
|
22.5 |
(9.1) |
|
94.8 |
|
| 2001 |
|
27.7 |
(11.2) |
|
26.9 |
(10.9) |
|
97.3 |
|
| 2002 |
|
31.6 |
(12.8) |
|
31.3 |
(12.7) |
|
99.0 |
|
| 2003 |
|
34.6 |
(14.0) |
|
34.3 |
(13.9) |
|
99.1 |
|
| 2004 |
|
35.6 |
(14.4) |
|
35.3 |
(14.3) |
|
99.3 |
|
| 2005 |
|
37.6 |
(15.2) |
|
37.4 |
(15.1) |
|
99.5 |
|
| 2006 |
|
38.0 |
(15.4) |
|
37.8 |
(15.3) |
|
99.5 |
|
| 2007 |
|
41.5 |
(16.8) |
|
39.5 |
(16.0) |
|
95.2 |
|
| 2008 |
|
44.9 |
(18.2) |
|
44.7 |
(18.1) |
|
99.4 |
|
| 2009 |
|
46.9 |
(19.0) |
|
46.4 |
(18.8) |
|
98.9 |
|
Brazil |
|
| Year |
|
Total
Acres/Ha |
|
Biotech
Acres/Ha |
|
Biotech
Percent |
|
| 1997 |
|
32.1 |
(13.0) |
|
0.6 |
(0.30) |
|
2.0 |
|
| 1998 |
|
31.9 |
(12.9) |
|
2.6 |
(1.0) |
|
8.0 |
|
| 1999 |
|
33.6 |
(13.6) |
|
5.0 |
(2.0) |
|
15.0 |
|
| 2000 |
|
34.3 |
(13.9) |
|
8.2 |
(3.3) |
|
24.0 |
|
| 2001 |
|
39.3 |
(15.9) |
|
11.8 |
(4.8) |
|
30.0 |
|
| 2002 |
|
43.8 |
(17.7) |
|
14.0 |
(5.7) |
|
32.0 |
|
| 2003 |
|
52.6 |
(21.3) |
|
17.9 |
(7.2) |
|
34.0 |
|
| 2004 |
|
56.3 |
(22.8) |
|
19.1 |
(7.7) |
|
34.0 |
|
| 2005 |
|
54.3 |
(22.0) |
|
26.6 |
(10.8) |
|
49.0 |
|
| 2006 |
|
49.9 |
(20.2) |
|
27.9 |
(11.3) |
|
56.0 |
|
| 2007 |
|
54.4 |
(22.0) |
|
35.8 |
(14.5) |
|
65.9 |
|
| 2008 |
|
54.1 |
(21.9) |
|
35.1 |
(14.2) |
|
64.8 |
|
| 2009 |
|
56.6 |
(22.9) |
|
40.01 |
(16.2) |
|
70.7 |
|
|
Sources: Planted areas based on USDA/FAS March 2010 Table 11 Soybean Area, Yield and Production. Biotech-enhanced percentages for the U.S. based on USDA Economic Research Service data; Argentina and Brazilian percentages based on data from the International Service for the Acquisition of Agri-biotech Applications (ISAAA).
These three countries (the United States, Argentina and Brazil combined) produced 92 percent of the world's soybean exports and 86 percent of the world’s soybean meal exports. |
|
|
|
Return to Soy Stats homepage |
Order a printed Soy Stats |
|
Major funding for the 2010 edition of Soy Stats® was provided by the United Soybean Board, with additional financial support from the Iowa Soybean Association, Illinois Soybean Association, Indiana Soybean Alliance, South Dakota Soybean Research & Promotion Council, North Dakota Soybean Council, U.S. Soybean Export Council, Ohio Soybean Council, Kentucky Soybean Board, Kansas Soybean Commission, Tennessee Soybean Promotion Council, Minnesota Soybean Research & Promotion Council, North Carolina Soybean Producers Association, and Arkansas Soybean Association & Texas Soybean Association. |
Soy
Stats®
is copyright © 1994-2010 The American Soybean Association. All Rights
Reserved. |
|
|
|
|