|
|
|
U.S.
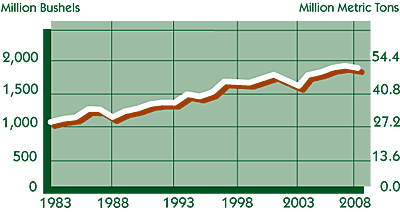
Soybean Crush 1983-2008 |

|
Million Bushels
(Million Metric Tons) |
1983
1984
1985
1986
1987
1988
1989
1990
1991 |
983
1,030
1,053
1,179
1,174
1,058
1,146
1,187
1,254 |
(26.76)
(28.03)
(28.66)
(32.09)
(31.95)
(28.80)
(31.19)
(32.31)
(34.13) |
|
|
1992
1993
1994
1995
1996
1997
1998
1999
2000 |
1,279
1,276
1,405
1,370
1,436
1,597
1,590
1,579
1,641 |
(34.81)
(34.73)
(38.24)
(37.29)
(39.08)
(43.47)
(43.28)
(42.98)
(44.67) |
|
|
2001
2002
2003
2004
2005
2006
2007
2008 |
1,700
1,615
1,530
1,696
1,739
1,806
1,835
1,801 |
(46.27)
(43.96)
(41.64)
(46.16)
(47.33)
(49.16)
(49.95)
(49.02) |
|
| Source: USDA |
|
|
|
Return to Soy Stats homepage |
Order a printed Soy Stats |
|
Major funding for the 2009 edition of Soy Stats® was provided by the United Soybean
Board, with additional financial
support of the Illinois Soybean Association, Indiana Soybean Alliance, Iowa Soybean Association, South Dakota Soybean Research & Promotion Council, North Dakota Soybean Council, Ohio Soybean Association, U.S. Soybean Export Council, Minnesota Soybean Research & Promotion Council, North Carolina Soybean Producers Association, Arkansas Soybean Association and Texas Soybean Association. |
Soy
Stats®
is copyright © 1994-2009 The American Soybean Association. All Rights
Reserved. |
|
|
|
|