|
|
|
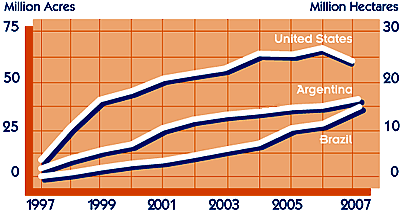
Adoption
of Biotech-enhanced Soybean Seedstock 1997-2007
(Major Exporting Countries Only) |

|
|
Million Acres
(Million Hectares) |
|
|
United States |
|
| Year |
|
Total
Acres/Ha |
|
Biotech
Acres/Ha |
|
Biotech
Percent |
|
| 1997 |
|
70.0 |
(28.3) |
|
8.9 |
(3.6) |
|
12.7 |
|
| 1998 |
|
72.0 |
(29.1) |
|
25.2 |
(10.2) |
|
35.0 |
|
| 1999 |
|
73.7 |
(29.8) |
|
37.1 |
(15.0) |
|
50.3 |
|
| 2000 |
|
74.3 |
(30.1) |
|
40.8 |
(16.5) |
|
54.9 |
|
| 2001 |
|
74.1 |
(30.0) |
|
52.61 |
(21.3) |
|
71.0 |
|
| 2002 |
|
72.8 |
(29.5) |
|
56.1 |
(22.7) |
|
77.0 |
|
| 2003 |
|
72.3 |
(29.3) |
|
58.6 |
(23.7) |
|
81.0 |
|
| 2004 |
|
75.2 |
(30.4) |
|
63.9 |
(25.8) |
|
85.0 |
|
| 2005 |
|
72.0 |
(29.1) |
|
62.6 |
(25.3) |
|
87.0 |
|
| 2006 |
|
75.5 |
(30.6) |
|
67.2 |
(27.2) |
|
89.0 |
|
| 2007 |
|
63.6 |
(25.7) |
|
57.8 |
(23.4) |
|
91.0 |
|
Argentina |
|
| Year |
|
Total
Acres/Ha |
|
Biotech
Acres/Ha |
|
Biotech
Percent |
|
| 1997 |
|
15.3 |
(6.2) |
|
3.5 |
(1.4) |
|
22.9 |
|
| 1998 |
|
17.3 |
(7.1) |
|
10.6 |
(4.3) |
|
61.2 |
|
| 1999 |
|
20.3 |
(7.0) |
|
15.8 |
(6.4) |
|
90.0 |
|
| 2000 |
|
23.7 |
(9.6) |
|
22.5 |
(9.1) |
|
94.8 |
|
| 2001 |
|
27.7 |
(11.2) |
|
26.9 |
(10.9) |
|
97.3 |
|
| 2002 |
|
31.6 |
(12.8) |
|
31.3 |
(12.7) |
|
99.0 |
|
| 2003 |
|
34.6 |
(14.0) |
|
34.3 |
(13.9) |
|
99.1 |
|
| 2004 |
|
35.6 |
(14.4) |
|
35.3 |
(14.3) |
|
99.3 |
|
| 2005 |
|
37.6 |
(15.2) |
|
37.4 |
(15.1) |
|
99.5 |
|
| 2006 |
|
38.0 |
(15.4) |
|
37.8 |
(15.3) |
|
99.5 |
|
| 2007 |
|
41.5 |
(16.8) |
|
39.5 |
(16.0) |
|
95.2 |
|
Brazil |
|
| Year |
|
Total
Acres/Ha |
|
Biotech
Acres/Ha |
|
Biotech
Percent |
|
| 1997 |
|
32.1 |
(13.0) |
|
0.6 |
(0.30) |
|
2.0 |
|
| 1998 |
|
31.9 |
(12.9) |
|
2.6 |
(1.0) |
|
8.0 |
|
| 1999 |
|
33.6 |
(13.6) |
|
5.0 |
(2.0) |
|
15.0 |
|
| 2000 |
|
34.3 |
(13.9) |
|
8.2 |
(3.3) |
|
24.0 |
|
| 2001 |
|
39.3 |
(15.9) |
|
11.8 |
(4.8) |
|
30.0 |
|
| 2002 |
|
43.8 |
(17.7) |
|
14.0 |
(5.7) |
|
32.0 |
|
| 2003 |
|
52.6 |
(21.3) |
|
17.9 |
(7.2) |
|
34.0 |
|
| 2004 |
|
56.3 |
(22.8) |
|
19.1 |
(7.7) |
|
34.0 |
|
| 2005 |
|
54.3 |
(22.0) |
|
26.6 |
(10.8) |
|
49.0 |
|
| 2006 |
|
49.9 |
(20.2) |
|
27.9 |
(11.3) |
|
56.0 |
|
| 2007 |
|
54.4 |
(20.0) |
|
35.8 |
(14.5) |
|
65.9 |
|
| Sources: Planted areas based on USDA/FAS November 2007 Table 11 Soybean Area, Yield and Production. Biotech-enhanced percentages for the U.S. based on USDA National Agricultural Statistics Service estimates; Argentina and Brazilian percentages based on data from the International Service for the Acquisition of Agri-biotech Applications
(ISAAA).
These three countries (the United States, Argentina and Brazil combined) produce more than 90 percent of the world's soybean exports. |
|
|
| Return to Soy Stats homepage |
Order a printed Soy Stats |
| Major funding for the 2008 edition of Soy StatsÒ was
provided by the United Soybean Board, with additional financial
support of the Illinois Soybean Association, Indiana Soybean Alliance,
Iowa Soybean Association, Ohio Soybean Association, South Dakota Soybean Research &
Promotion Council, North Dakota Soybean Council, the U.S. Soybean
Export Council, Minnesota Soybean Research & Promotion Council,
North Carolina Soybean Producers Association, Arkansas Soybean
Association and Texas Soybean Association. |
Soy
Stats®
is copyright © 1994-2008 The American Soybean Association. All Rights
Reserved. |
|
|
|
|