
|
|
|
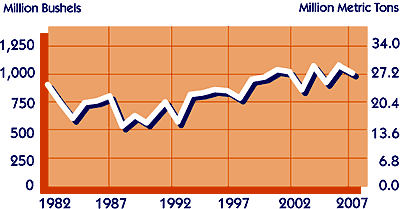
U.S.
Soybean Exports 1982-2007 |
|
Million Bushels
(Million Metric Tons) |
1982
1983
1984
1985
1986
1987
1988
1989
1990 |
905
743
598
740
757
802
527
623
557 |
(24.63)
(20.22)
(16.28)
(20.14)
(20.60)
(21.83)
(14.34)
(16.96)
(15.16) |
|
|
1991
1992
1993
1994
1995
1996
1997
1998
1999 |
684
770
589
838
851
882
872
805
975 |
(18.62)
(20.96)
(16.03)
(22.81)
(23.16)
(24.00)
(23.76)
(21.91)
(26.54) |
|
|
2000
2001
2002
2003
2004
2005
2006
2007 |
996
1,063
1,045
880
1,097
940
1,118
1,025 |
(27.10)
(28.92)
(28.44)
(23.95)
(29.86)
(25.90)
(30.43)
(27.90) |
|
|
|
|
| Source: USDA |
|
|
| Return to Soy Stats homepage |
Order a printed Soy Stats |
| Major funding for the 2008 edition of Soy StatsŇ was
provided by the United Soybean Board, with additional financial
support of the Illinois Soybean Association, Indiana Soybean Alliance,
Iowa Soybean Association, Ohio Soybean Association, South Dakota Soybean Research &
Promotion Council, North Dakota Soybean Council, the U.S. Soybean
Export Council, Minnesota Soybean Research & Promotion Council,
North Carolina Soybean Producers Association, Arkansas Soybean
Association and Texas Soybean Association. |
Soy
Stats®
is copyright © 1994-2008 The American Soybean Association. All Rights
Reserved. |
|
|
|
|