
|
|
|
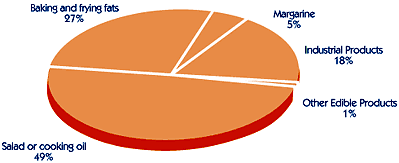
U.S.
Soybean Oil Consumption 2007 |
|
|
Million
Pounds |
|
Million
Metric Tons |
|
|
. |
|
. |
|
| Salad or
Cooking Oil |
9,712 |
|
4.41 |
|
| Baking and
Frying Fats |
5,377 |
|
2.44 |
|
| Industrial
Products |
3,616 |
|
1.64 |
|
| Margarine |
902 |
|
0.41 |
|
| Other Edible
Products |
108 |
|
0.05 |
|
|
. |
|
. |
|
| Total |
19,716 |
. |
8.94 |
|
|
. |
|
. |
|
| Source: U.S. Census Bureau,
Calendar Year, subject to revision |
|
|
| Return to Soy Stats homepage |
Order a printed Soy Stats |
| Major funding for the 2008 edition of Soy StatsŇ was
provided by the United Soybean Board, with additional financial
support of the Illinois Soybean Association, Indiana Soybean Alliance,
Iowa Soybean Association, Ohio Soybean Association, South Dakota Soybean Research &
Promotion Council, North Dakota Soybean Council, the U.S. Soybean
Export Council, Minnesota Soybean Research & Promotion Council,
North Carolina Soybean Producers Association, Arkansas Soybean
Association and Texas Soybean Association. |
Soy
Stats®
is copyright © 1994-2008 The American Soybean Association. All Rights
Reserved. |
|
|
|
|