|
|
|
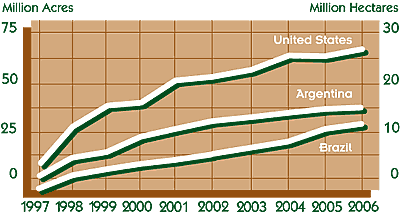
Adoption
of Biotech-enhanced Soybean Seedstock 1997-2006
(Major Exporting Countries Only) |

|
|
Million Acres
(Million Hectares) |
|
|
United States |
|
| Year |
|
Total
Acres/Ha |
|
Biotech
Acres/Ha |
|
Biotech
Percent |
|
| 1997 |
|
70.0 |
(28.3) |
|
8.9 |
(3.6) |
|
12.7 |
|
| 1998 |
|
72.0 |
(29.1) |
|
25.2 |
(10.2) |
|
35.0 |
|
| 1999 |
|
73.7 |
(29.8) |
|
37.1 |
(15.0) |
|
50.3 |
|
| 2000 |
|
74.3 |
(30.1) |
|
40.8 |
(16.5) |
|
54.9 |
|
| 2001 |
|
74.1 |
(30.0) |
|
52.61 |
(21.3) |
|
71.0 |
|
| 2002 |
|
72.8 |
(29.5) |
|
56.1 |
(22.7) |
|
77.0 |
|
| 2003 |
|
72.3 |
(29.3) |
|
58.6 |
(23.7) |
|
81.0 |
|
| 2004 |
|
75.2 |
(30.4) |
|
63.9 |
(25.8) |
|
85.0 |
|
| 2005 |
|
72.0 |
(29.1) |
|
62.6 |
(25.3) |
|
87.0 |
|
| 2006 |
|
75.5 |
(30.6) |
|
67.2 |
(27.2) |
|
89.0 |
|
Argentina |
|
| Year |
|
Total
Acres/Ha |
|
Biotech
Acres/Ha |
|
Biotech
Percent |
|
| 1997 |
|
15.3 |
(6.2) |
|
3.5 |
(1.4) |
|
22.9 |
|
| 1998 |
|
17.3 |
(7.1) |
|
10.6 |
(4.3) |
|
61.2 |
|
| 1999 |
|
20.3 |
(7.0) |
|
15.8 |
(6.4) |
|
90.0 |
|
| 2000 |
|
23.7 |
(9.6) |
|
22.5 |
(9.1) |
|
94.8 |
|
| 2001 |
|
27.7 |
(11.2) |
|
26.9 |
(10.9) |
|
97.3 |
|
| 2002 |
|
31.6 |
(12.8) |
|
31.3 |
(12.7) |
|
99.0 |
|
| 2003 |
|
34.6 |
(14.0) |
|
34.3 |
(13.9) |
|
99.1 |
|
| 2004 |
|
35.6 |
(14.4) |
|
35.3 |
(14.3) |
|
99.3 |
|
| 2005 |
|
37.6 |
(15.2) |
|
37.4 |
(15.1) |
|
99.5 |
|
| 2006 |
|
38.0 |
(15.4) |
|
37.8 |
(15.3) |
|
99.5 |
|
Brazil* |
|
| Year |
|
Total
Acres/Ha |
|
Biotech
Acres/Ha |
|
Biotech
Percent |
|
| 1997 |
|
32.1 |
(13.0) |
|
0.6 |
(0.3) |
|
2 |
|
| 1998 |
|
31.9 |
(12.9) |
|
2.6 |
(1.0) |
|
8 |
|
| 1999 |
|
33.6 |
(13.6) |
|
5.0 |
(2.0) |
|
15 |
|
| 2000 |
|
34.3 |
(13.9) |
|
8.2 |
(3.3) |
|
24 |
|
| 2001 |
|
39.3 |
(15.9) |
|
11.8 |
(4.8) |
|
30 |
|
| 2002 |
|
43.8 |
(17.7) |
|
14.0 |
(5.7) |
|
32 |
|
| 2003 |
|
52.6 |
(21.3) |
|
17.9 |
(7.2) |
|
34 |
|
| 2004 |
|
56.3 |
(22.8) |
|
19.1 |
(7.7) |
|
34 |
|
| 2005 |
|
54.3 |
(22.0) |
|
26.6 |
(10.8) |
|
49 |
|
| 2006 |
|
49.9 |
(20.2) |
|
27.9 |
(11.3) |
|
56 |
|
| Sources: Planted areas based on USDA/FAS August 2006 Table 4 Major Oilseeds. Biotech-enhanced percentages for the U.S. based on USDA Economic Research Service data; Argentina percentages based on data from the Argentine Council for Information and Development of Biotechnology; Brazil percentages based on estimates by the Brazilian Biotechnology Information Council.
These three countries (the United States, Argentina and Brazil combined) produce more than 93 percent of the world's soybean exports. |
|
|
| Return to Soy Stats homepage |
Order a printed Soy Stats |
|
The
2007 Soy Stats Guide is sponsored by the
Illinois Soybean Association, Indiana Soybean Alliance, Minnesota
Soybean Research & Promotion Council, North Dakota Soybean Council, Ohio
Soybean Council, Iowa Soybean Association, South Dakota Soybean Research
& Promotion Council, and the Kentucky Soybean Board.
|
Soy Stats™ is copyright ©
1994-2007 The American Soybean Association.
All Rights Reserved. |
|
|
|
|