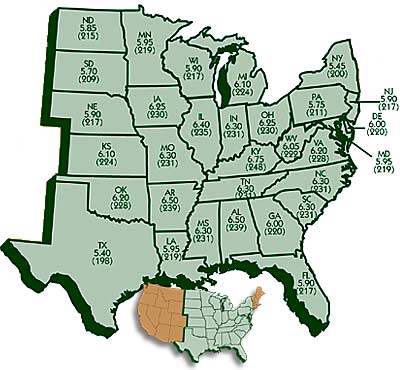
Alabama
Arkansas
Delaware
Florida
Georgia
Illinois
Indiana
Iowa
Kansas
Kentucky
Louisiana |
6.50
6.50
6.00
5.90
6.00
6.40
6.30
6.25
6.10
6.75
5.95 |
(239)
(239)
(220)
(217)
(220)
(235)
(231)
(230)
(224)
(248)
(219) |
|
Maryland
Michigan
Minnesota
Mississippi
Missouri
Nebraska
New Jersey
New York
N. Carolina
N. Dakota
Ohio |
5.95
6.10
5.95
6.30
6.30
5.90
5.90
5.45
6.30
5.85
6.25 |
(219)
(224)
(219)
(231)
(231)
(217)
(217)
(200)
(231)
(215)
(230) |
|
Oklahoma
Pennsylvania
S. Carolina
S. Dakota
Tennessee
Texas
Virginia
West Virginia
Wisconsin |
6.20
5.75
6.30
5.70
6.30
5.40
6.20
6.05
5.90 |
(228)
(211)
(231)
(209)
(231)
(198)
(228)
(222)
(217) |
|