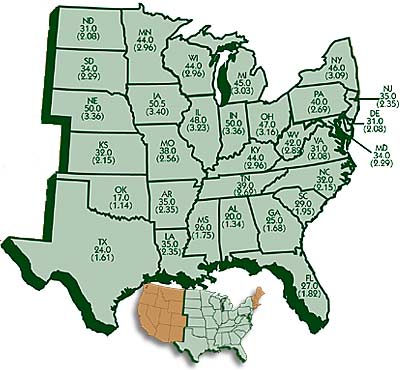
Alabama
Arkansas
Delaware
Florida
Georgia
Illinois
Indiana
Iowa
Kansas
Kentucky
Louisiana |
20.0
35.0
31.0
27.0
25.0
48.0
50.0
50.5
32.0
44.0
35.0 |
(1.34)
(2.35)
(2.08)
(1.82)
(1.68)
(3.23)
(3.36)
(3.40)
(2.15)
(2.96)
(2.35) |
|
Maryland
Michigan
Minnesota
Mississippi
Missouri
Nebraska
New Jersey
New York
N. Carolina
N. Dakota
Ohio |
34.0
45.0
44.0
26.0
38.0
50.0
35.0
46.0
32.0
31.0
47.0 |
(2.29)
(3.03)
(2.96)
(1.75)
(2.56)
(3.36)
(2.35)
(3.09)
(2.15)
(2.08)
(3.16) |
|
Oklahoma
Pennsylvania
S. Carolina
S. Dakota
Tennessee
Texas
Virginia
W. Virginia
Wisconsin |
17.0
40.0
29.0
34.0
39.0
24.0
31.0
42.0
44.0 |
(1.14)
(2.69)
(1.95)
(2.29)
(2.62)
(1.61)
(2.08)
(2.82)
(2.96) |
|