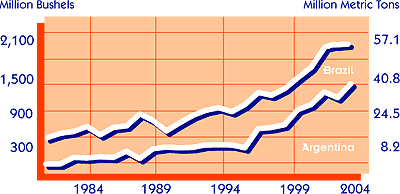
Brazil & Argentina Soybean Production 1979-2004

Million Bushels  (Million Metric Tons)

Brazil

1979
1980
1981
1982
1983
1984
1985
1986
1987
1988
1989
1990
1991
1992
1993
1994
1995
1996
1997
1998
1999
2000
2001
2002
2003
2004

557
559
472
542
571
672
581
636
662
853
747
579
709
827
907
952
887
1,003
1,194
1,150
1,257
1,433
1,598
1,910
1,933
1,947

(15.16)
(15.22)
(12.85)
(14.75)
(15.54)
(18.29)
(14.10)
(17.31)
(18.02)
(23.22)
(20.33)
(15.76)
(19.30)
(22.51)
(24.69)
(25.91)
(24.15)
(27.30)
(32.50)
(31.30)
(34.20)
(39.00)
(43.50)
(52.00)
(52.60)
(53.00)

Argentina

1979
1980
1981
1982
1983
1984
1985
1986
1987
1988
1989
1990
1991
1992
1993
1994
1995
1996
1997
1998
1999
2000
2001
2002
2003
2004
132
129
153
154
257
248
268
257
356
239
395
423
410
417
456
459
457
411
716
735
779
1,021
1,102
1,304
1,212
1,433
(3.59)
(3.51)
(4.16)
(4.19)
(7.00)
(6.75)
(7.29)
(7.00)
(9.69)
(6.51)
(10.75)
(11.51)
(11.16)
(11.35)
(12.41)
(12.49)
(12.44)
(11.20)
(19.50)
(20.00)
(21.20)
(27.80)
(30.00)
(35.50)
(33.00)
(39.00)
 

Source: USDA


Return to Soy Stats homepage Order a printed Soy Stats
The 2005 edition of Soy Stats Online is sponsored by
Syngenta Seeds

Soy Stats™ is copyright © 1994-2005 The American Soybean Association. All Rights Reserved.