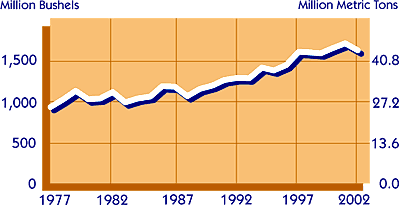
1977
1978
1979
1980
1981
1982
1983
1984
1985 |
927
1,018
1,123
1,020
1,030
1,108
983
1,030
1,053 |
(25.23)
(27.71)
(30.57)
(27.76)
(28.03)
(30.16)
(26.76)
(28.03)
(28.66) |
|
|
1986
1987
1988
1989
1990
1991
1992
1993
1994 |
1,179
1,174
1,058
1,146
1,187
1,254
1,279
1,276
1,405 |
(32.09)
(31.95)
(28.80)
(31.19)
(32.31)
(34.13)
(34.81)
(34.73)
(38.24) |
|
|
1995
1996
1997
1998
1999
2000
2001
2002 |
1,370
1,436
1,597
1,590
1,579
1,641
1,700
1,615 |
(37.29)
(39.08)
(43.47)
(43.28)
(42.98)
(44.67)
(46.27)
(43.96) |
|