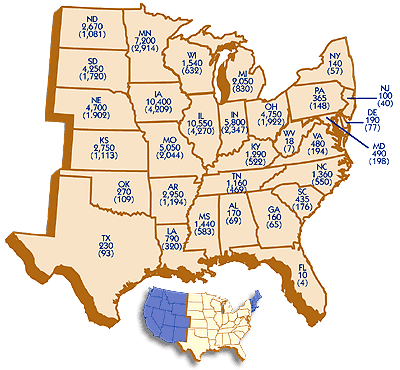
Alabama
Arkansas
Delaware
Florida
Georgia
Illinois
Indiana
Iowa
Kansas
Kentucky
Louisiana |
170
2,950
190
10
160
10,550
5,800
10,400
2,750
1,290
790 |
(69)
(1,194)
(77)
(4)
(65)
(4,270)
(2,347)
(4,209)
(1,113)
(522)
(320) |
|
Maryland
Michigan
Minnesota
Mississippi
Missouri
Nebraska
NewJersey
New York
N.Carolina
N.Dakota
Ohio |
490
2,050
7,200
1,440
5,050
4,700
100
140
1,360
2,670
4,750 |
(198)
(830)
(2,914)
(583)
(2,044)
(1,902)
(40)
(57)
(550)
(1,081)
(1,922) |
|
Oklahoma
Pennsylvania
S.Carolina
S.Dakota
Tennessee
Texas
Virginia
W.Virginia
Wisconsin |
270
365
435
4,250
1,160
230
480
18
1,540 |
(109)
(148)
(176)
(1,720)
(469)
(93)
(194)
(7)
(623) |
|