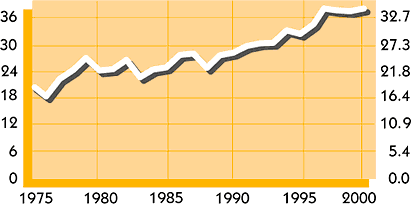
1975
1976
1977
1978
1979
1980
1981
1982
1983
1984
1985
1986
1987 |
20.8/$158
18.5/$219
22.4/$179
24.4/$206
27.1/$197
24.3/$235
24.6/$197
26.7/$201
22.8/$203
24.5/$136
25.0/$166
27.8/$177
28.1/$239 |
(18.9/$174)
(16.8/$241)
(20.3/$198)
(22.1/$227)
(24.6/$217)
(22.0/$259)
(22.3/$217)
(24.2/$221)
(20.7/$224)
(22.2/$150)
(22.7/$183)
(25.2/$195)
(25.5/$264) |
|
1988
1989
1990
1991
1992
1993
1994
1995
1996
1997
1998
1999
2000 |
24.9/$252
27.7/$186
28.3/$181
29.8/$189
30.4/$194
30.5/$193
33.3/$163
32.5/$236
34.2/$262
38.2/$185
37.8/$139
37.6/$168
38.2/$168 |
(22.6/$278)
(25.1/$206)
(25.7/$200)
(27.0/$209)
(27.6/$214)
(27.7/$213)
(30.2/$179)
(29.5/$260)
(31.0/$289)
(34.7/$204)
(34.3/$153)
(34.1/$185)
(34.7/$185) |